/Retail-title.png?width=302&height=80&name=Retail-title.png)
XXII transforme les flux vidéo des points de vente en données actionnables et maîtrisées.
/HERO.png?width=1760&height=1571&name=HERO.png)
![]()
XXII transforms video streams into actionable data to streamline the passenger journey. Stations, airports, ports: our computer vision technology enables precise crowd management and proactive incident detection.


While every digital journey is tracked and analyzed, physical flows across halls, stations, terminals, and ports often remain invisible. For infrastructure operators, there is a goldmine of untapped data at the heart of transport networks—but it lacks visibility.
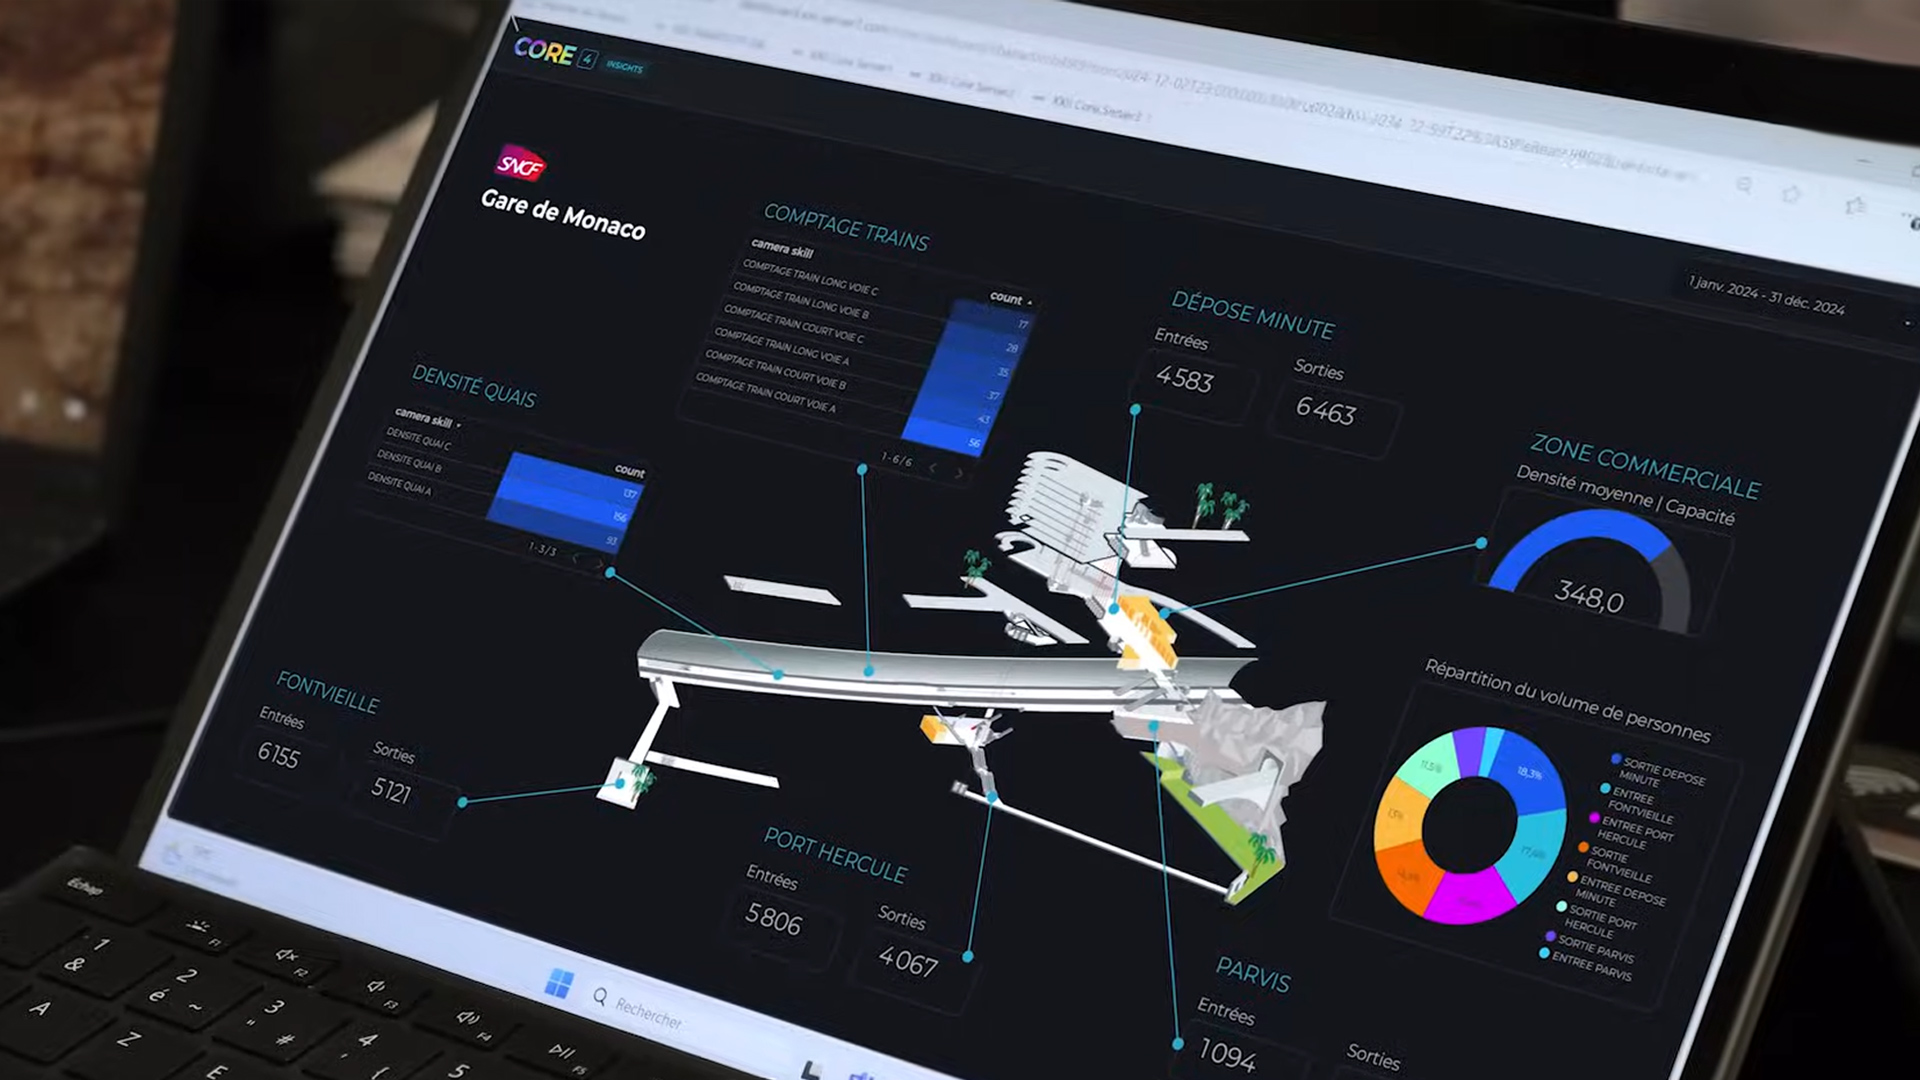
CORE turns your cameras into intelligent sensors, making your hubs as measurable, seamless, and secure as a digital platform.

Des usages concret, des résultats mesurables.
![]() Segmentation visiteurs.
Segmentation visiteurs.![]() Affluence magasin.
Affluence magasin.![]() Taux d'occupation.
Taux d'occupation.![]() Analyses saisonnières.
Analyses saisonnières.![]() Temps moyen.
Temps moyen.![]() Comparaison PDV.
Comparaison PDV.
![]() Cartographie du parcours.
Cartographie du parcours.![]() Taux de transition.
Taux de transition.![]() Zone d'attraction.
Zone d'attraction.![]() Aménagement.
Aménagement.![]() File d'attente.
File d'attente.![]() Point de rupture.
Point de rupture.
![]() Engagement animations.
Engagement animations.![]() Interaction vendeurs.
Interaction vendeurs.![]() Usage des bornes & écrans.
Usage des bornes & écrans.![]() Essais produits.
Essais produits.![]() Besoin d'assistance
Besoin d'assistance![]() Interaction produit.
Interaction produit.
![]() Performance retail media.
Performance retail media.![]() Taux de conversion.
Taux de conversion.![]() Impact campagnes.
Impact campagnes.![]() Abandon en caisse
Abandon en caisse![]() Conversion par zones.
Conversion par zones.![]() Sortie sans achat.
Sortie sans achat.

#Safety&Efficiency
Detect unauthorized presence on railway tracks, tram tracks, airport tarmac, port docks, or boarding ramps.
#Attendance
Monitor real-time occupancy to prevent overcrowding.

#Journey
Visualize complete passenger routes to improve fluidity and reduce bottlenecks.

#Operation
Analyze when passengers move out of typical flows to identify inefficiencies.

#Safety&Efficiency
Detect bags or objects left unattended for a defined amount of time, without identifying individuals.

#Attendance
Measure the average time passengers spend in zones to optimize processes and anticipate delays.

#Journey
Detect where passengers abandon a path to improve guidance.
#Operation
Interaction with kiosks, ticket machines, counters, boarding gates, etc. to optimize placement and availability.
#Safety&Efficiency
Detect people who remain immobile for an unusual duration in high-risk areas, potentially indicating medical emergencies.
#Attendance
Anticipate seasonal or event-based peaks to plan staff, equipment, and space usage.
#Journey
Identify areas where passengers naturally stop or cluster to optimize flow.
#Operation
Measure interactions with agents to improve staffing strategies.

#Attendance
Align staff deployment with real passenger volumes to improve flow, service quality, and operational efficiency.

#Journey
Measure transition efficiency between key operational zones.
#Operation
Detect passengers showing signals of needing help.
#Safety&Efficiency
Detect early visual signs of smoke, abnormal heat signatures, or fire-related anomalies in public or restricted zones.

#Attendance
Identify zones where traffic slows down or becomes blocked to adjust layout, access, or resources.
#Journey
Detect and measure waiting times to improve resource allocation and reduce congestion.

#Operation
Use rate of kiosks, ticket machines and self-check-in to optimize assistance and maintenance.

#Safety&Efficiency
Detect unauthorized entry into restricted or sensitive areas such as tracks, runways, boarding zones, maintenance areas, etc.

#Attendance
Understand how groups behave statistically without identifying individuals — to adapt flows and signage.
#Journey
Measure how infrastructures affect passenger circulation.
#Operation
Measure interaction with baggage drop areas, boarding counters, turnstiles, or port boarding lanes to improve operations.

#Safety&Efficiency
Identify passengers falling on platforms, stairs, escalators, pedestrian routes, or gangways.

/Picto_INSIGHTS_Dark.png?width=60&height=60&name=Picto_INSIGHTS_Dark.png) Insights. Insights.
Insights. Insights.
/Picto_EVENTS_Dark.png?width=60&height=60&name=Picto_EVENTS_Dark.png) Events.
Events.

![]()
Transform the physical world into data.
![]()
Ai vision software