Computer vision at the service
of a smoother, more reliable, more sustainable supply chain.
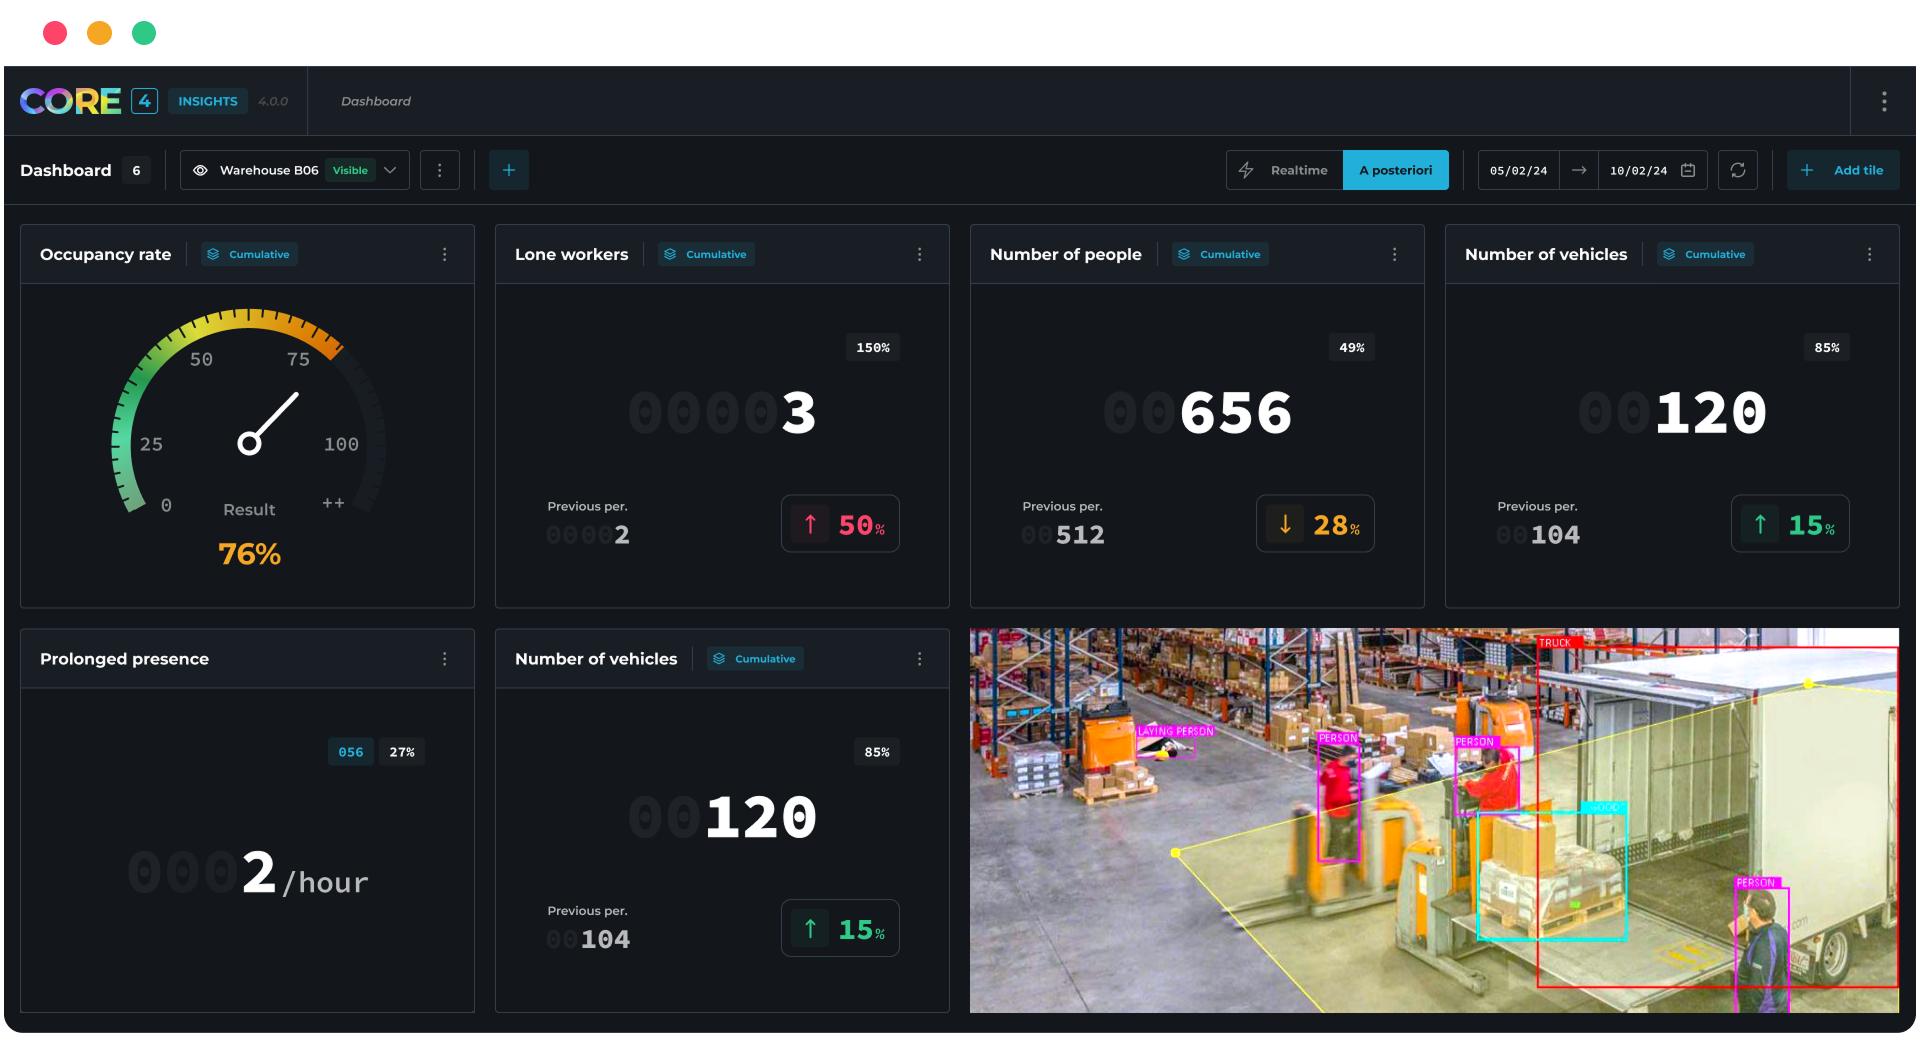
Supervise operations in real time to streamline movements, avoid bottlenecks and accelerate production rates.
Automatically detect incidents, malfunctions or anomalies so you can intervene faster and avoid downtime.
Analyze your field data to adjust resources, anticipate peaks in activity and improve overall productivity.
/Retail-title.png?width=302&height=80&name=Retail-title.png)
XXII transforme les flux vidéo des points de vente en données actionnables et maîtrisées.
/HERO.png?width=1760&height=1571&name=HERO.png)

XXII transforms video streams from industrial sites into actionable, controlled data.


XXII transforms video streams from industrial sites into actionable, controlled data.


While every stage of the transportation process is tracked and digitized, warehouse operations remain largely opaque.
Logistics professionals have a goldmine of data at their sites, but they aren’t making use of it. Our challenge: to make your facilities as seamless, intelligent, and optimized as a sorting algorithm.

Des usages concret, des résultats mesurables.
![]() Segmentation visiteurs.
Segmentation visiteurs.![]() Affluence magasin.
Affluence magasin.![]() Taux d'occupation.
Taux d'occupation.![]() Analyses saisonnières.
Analyses saisonnières.![]() Temps moyen.
Temps moyen.![]() Comparaison PDV.
Comparaison PDV.
![]() Cartographie du parcours.
Cartographie du parcours.![]() Taux de transition.
Taux de transition.![]() Zone d'attraction.
Zone d'attraction.![]() Aménagement.
Aménagement.![]() File d'attente.
File d'attente.![]() Point de rupture.
Point de rupture.
![]() Engagement animations.
Engagement animations.![]() Interaction vendeurs.
Interaction vendeurs.![]() Usage des bornes & écrans.
Usage des bornes & écrans.![]() Essais produits.
Essais produits.![]() Besoin d'assistance
Besoin d'assistance![]() Interaction produit.
Interaction produit.
![]() Performance retail media.
Performance retail media.![]() Taux de conversion.
Taux de conversion.![]() Impact campagnes.
Impact campagnes.![]() Abandon en caisse
Abandon en caisse![]() Conversion par zones.
Conversion par zones.![]() Sortie sans achat.
Sortie sans achat.
#Operations
Automatic verification of high-visibility safety vest usage at the entrance of critical areas (shipping, docks).

#Attendance
Statistical data on the use of pedestrian crossings and monitoring of people flow by zone and time slot.

#Journey
Analysis of flows of people and vehicles between major zones to manage internal supply chain operations.
#Interactions
Detection and recording of near-collisions to support risk analysis and safety feedback (RETEX).

#Operations
Immediate detection of a person on the ground to trigger real-time alerts and accelerate emergency response.

#Attendance
Real-time measurement of the occupancy rate of key areas to optimize team allocation.

#Journey
Detection of wrong-way movements in one-way aisles, with real-time alerts to prevent collisions.
#Interactions
Detection of forklifts parked too long, blocking traffic lanes and creating operational risks.
#Operations
Detection of goods or pallets placed in front of emergency exits, with real-time alerts and occupancy tracking.

#Attendance
Automatic counting of logistics vehicles (carts, forklifts, trucks) by zone and direction of movement.

#Journey
Detection of pedestrian crossings outside designated safe zones, with statistics and configurable alerts.
#Interactions
Detection of people entering restricted areas (loading zones, technical rooms) without authorization.
#Attendance
Counting entries and exits at the main access points of the site to monitor overall traffic and ensure capacity compliance.

#Journey
Mapping operator paths to identify inefficiencies, congestion, and optimize picking.

#Interactions
Only authorized pallet trucks allowed; detection of unauthorized forklifts and real-time alerts.

#Operations
Verification that forklift operators follow safety protocols in high-risk areas.

#Attendance
Automatic identification of peak traffic periods by zone to anticipate staffing and equipment needs.

#Journey
Generation of heatmaps to rethink layouts and reduce dangerous crossing points.

#Interactions
Detection of risky interactions between pedestrians and forklifts in crossing zones, with audible or visual alerts.

#Operations
Detection of objects or waste on the floor in traffic areas to maintain a clean and safe environment.

#Attendance
Real-time monitoring of loading/unloading dock occupancy to optimize rotation planning.

#Journey
Measurement of travel times between key points to detect bottlenecks.
#Interactions
Detection of loading/unloading operations to measure idle times and optimize turnaround.

#Operations
Detection of work areas with abnormal inactivity to identify malfunctions or reallocation needs.

/Picto_INSIGHTS_Dark.png?width=60&height=60&name=Picto_INSIGHTS_Dark.png) Insights. Insights.
Insights. Insights.
/Picto_EVENTS_Dark.png?width=60&height=60&name=Picto_EVENTS_Dark.png) Events.
Events.

Management & Financial Performance.
Manage your logistics operations with precise indicators: reduction of non-quality costs, flow optimization, loss reduction, and productivity improvement. Identify inefficiencies and focus your investments where ROI is immediate.

Safety & On-Site Compliance.
Measure and continuously improve compliance with safety regulations through automated detection (PPE usage, risks). Reduce accidents, limit work stoppages, and strengthen regulatory compliance while protecting your teams.

Operations & Field Efficiency.
Optimize your logistics processes in real time: smoother flows, reduced waiting times, and better team coordination. Improve operational efficiency while reducing costs related to errors, incidents, and disruptions.
Management & Financial Performance.
Manage your logistics operations with precise indicators: reduction of non-quality costs, flow optimization, loss reduction, and productivity improvement. Identify inefficiencies and focus your investments where ROI is immediate.
Safety & On-Site Compliance.
Measure and continuously improve compliance with safety regulations through automated detection (PPE usage, risks). Reduce accidents, limit work stoppages, and strengthen regulatory compliance while protecting your teams.
Operations & Field Efficiency.
Optimize your logistics processes in real time: smoother flows, reduced waiting times, and better team coordination. Improve operational efficiency while reducing costs related to errors, incidents, and disruptions.

![]()
![]()
Transform the physical world into data.
![]()
Ai vision software