/Retail-title.png?width=302&height=80&name=Retail-title.png)
XXII transforme les flux vidéo des points de vente en données actionnables et maîtrisées.
/HERO.png?width=1760&height=1571&name=HERO.png)

Computer vision for ERP
for a smooth, safe and optimized visitor experience.

/Retail-title-black.png?width=302&height=80&name=Retail-title-black.png)
XXII transforme les flux vidéo des points de vente en données actionnables et maîtrisées.
/Hero-Retail.png?width=1200&height=1071&name=Hero-Retail.png)


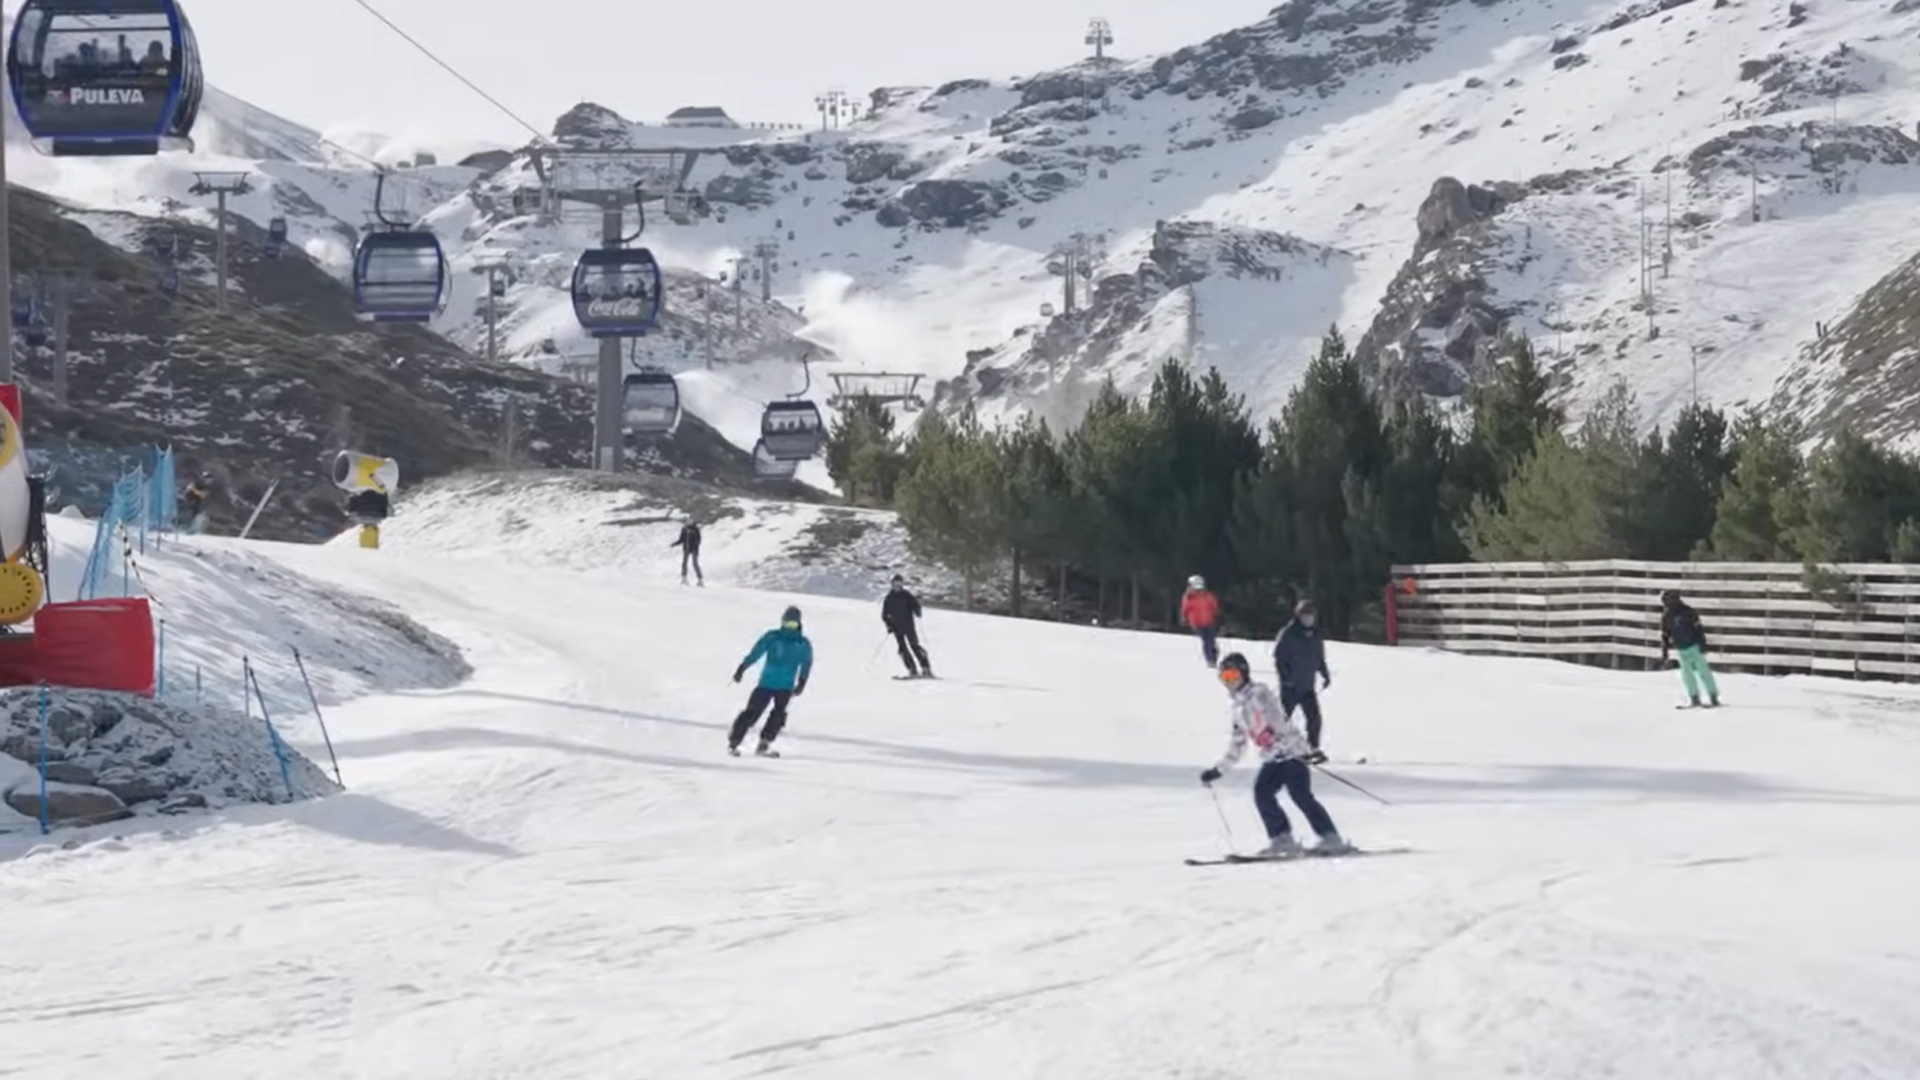
While e-commerce analyzes every click, physical spaces (stadiums, train stations, shopping centers) too often remain black boxes.
XXII lifts the veil through computer vision. We turn your existing cameras into intelligent sensors, enabling you to manage your venues with the same level of precision as a website.

Des usages concret, des résultats mesurables.
![]() Segmentation visiteurs.
Segmentation visiteurs.![]() Affluence magasin.
Affluence magasin.![]() Taux d'occupation.
Taux d'occupation.![]() Analyses saisonnières.
Analyses saisonnières.![]() Temps moyen.
Temps moyen.![]() Comparaison PDV.
Comparaison PDV.
![]() Cartographie du parcours.
Cartographie du parcours.![]() Taux de transition.
Taux de transition.![]() Zone d'attraction.
Zone d'attraction.![]() Aménagement.
Aménagement.![]() File d'attente.
File d'attente.![]() Point de rupture.
Point de rupture.
![]() Engagement animations.
Engagement animations.![]() Interaction vendeurs.
Interaction vendeurs.![]() Usage des bornes & écrans.
Usage des bornes & écrans.![]() Essais produits.
Essais produits.![]() Besoin d'assistance
Besoin d'assistance![]() Interaction produit.
Interaction produit.
![]() Performance retail media.
Performance retail media.![]() Taux de conversion.
Taux de conversion.![]() Impact campagnes.
Impact campagnes.![]() Abandon en caisse
Abandon en caisse![]() Conversion par zones.
Conversion par zones.![]() Sortie sans achat.
Sortie sans achat.

#Conversion
Measurement of attention generated by screens, announcements or signage.
#Attendance
Unique visitor counting to measure the real entry volume.
#Journey
Analyse du passage entre halls, salles, stands ou zones d’exposition.

#Interactions
Interaction measurement with shops, food areas, partner stands or info points.
#Conversion
Comparison of areas based on their ability to generate engagement and satisfaction.
#Attendance
Unified indicators to manage all your venues and events consistently.
#Journey
Identification of areas generating the highest attention or dwell time.
#Interactions
Analysis of interactions with wayfinding screens, info displays or digital devices.
#Conversion
Analysis of early departures or incomplete visitor journeys.

#Attendance
Detection of arrival peaks to anticipate opening, screening and visitor reception.
#Journey
Evaluation of the impact of furniture, stand placement, signage or crowd barriers.
#Interactions
Analysis of touchpoints with visitor services, security or mediation staff.

#Attendance
Average time spent in your spaces to optimize mediation, operations and safety.
#Journey
Detection of where visitors stop, hesitate or abandon their journey.
#Interactions
Detection of visitors waiting for help (orientation, accessibility, mediation).

#Conversion
Measurement of visitors converting to active participation.
#Attendance
Analysis of presence across levels, zones, rooms, stands or pathways.
#Journey
Measurement of waiting times at entrances, checkpoints, cloakrooms or F&B.
#Interactions
Measurement of involvement in workshops, demos, performances or activations.

#Conversion
Analysis of traffic and interest in bars, food stalls, merchandising and retail areas.
#Attendance
Analysis of occupancy levels in halls, stands, galleries, rooms or exhibition areas.

#Journey
Understanding the actual journey to optimize signage and accessibility.
#Interactions
Measurement of interest in artworks, stands, stages, displays or experiences.
#Conversion
Ratio between potential flow and actual active engagement in a zone.

/Picto_INSIGHTS_Dark.png?width=60&height=60&name=Picto_INSIGHTS_Dark.png) Insights. Insights.
Insights. Insights.
/Picto_EVENTS_Dark.png?width=60&height=60&name=Picto_EVENTS_Dark.png) Events.
Events.
![]()
Transform the physical world into data.
![]()
Ai vision software