How can you compare the performance of multiple stores in real time?
To compare the performance of multiple retail locations in real time, retail operations managers rely on a video analytics platform capable of simultaneously aggregating data on foot traffic, customer journeys, interactions, and conversions across all locations. This approach allows stores to be benchmarked without waiting for weekly or monthly reports, and to instantly identify areas for improvement where needed.
Real-time, multi-site comparison has become essential in 2026.
For years, retail executives managed their networks blindly: sales figures delayed by 24 to 48 hours, manual reports consolidated by data teams, and decisions based on on-the-ground intuition rather than measurable facts.
By 2026, this model is obsolete. Pressure on margins, the rise of e-commerce, and increased demands for an exceptional in-store customer experience are forcing retail operations managers to have access to reliable, continuous, and comparable real-time data across their entire network.
The question is no longer “Is this store performing well?” but “Why is this store performing better than the others, and how can we replicate its best practices across the rest of the network?”
The 4 key metrics for measuring and comparing multi-site performance.
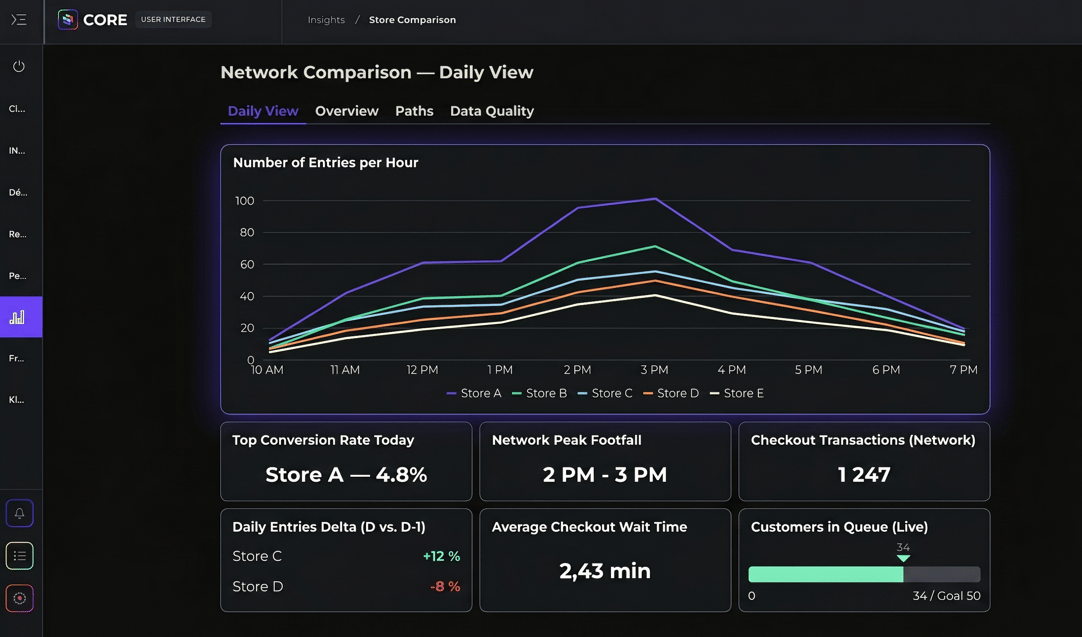
1. Foot traffic: understanding who comes in, when, and how many.
The first pillar of a meaningful multi-site comparison is the accurate measurement of actual foot traffic at each store. This involves much more than simply counting entries.
A granular analysis includes counting unique visitors (excluding staff and families counted more than once) to ensure reliable customer figures, segmenting visitors by profile (age, gender, style) to turn customer insights into a performance driver, occupancy rates by zone to assess the actual profitability of each square meter, and seasonal analysis to anticipate peak activity and plan for staffing and inventory.
Real-world example: A sports retailer uses CORE across six stores equipped with 500 cameras to optimize staff schedules based on actual foot traffic. A Product Manager at this major sports retailer sums it up: “CORE allows us to precisely identify the time spent with each customer, optimize schedules, and refocus our teams on what matters most: customer relations.”
2. The customer journey: mapping high-traffic areas and friction points.
Foot traffic alone isn’t enough. To effectively compare stores, you need to understand where customers go inside, how they move around, and where they drop off.
Key journey metrics include the transition rate between areas to identify high-performing zones and improve traffic flow; a comprehensive map of the visitor journey to visualize foot traffic and optimize store layout; attraction zones to pinpoint areas of interest and optimize product placement, drop-off points to detect abandonment and disengagement, and real-time queue monitoring to reduce friction at the point of purchase.
By comparing this data across multiple stores, an operations manager can immediately determine whether a friction point is site-specific (a local layout issue) or systemic (a concept or standard customer journey issue).
3. Interactions: measuring the effectiveness of service and merchandising.
The third dimension is that of interactions: between visitors and sales associates, between customers and products, and between consumers and in-store digital devices.
Key metrics include sales associate interactions to measure sales team effectiveness and optimize product availability and service; product trials to analyze the conversion rate between the volume of products tried and point-of-sale data; the need for assistance to identify visitors seeking advice, and the use of kiosks and screens to analyze the adoption of in-store digital devices.
These metrics help answer a key question for any operations manager: Are my frontline teams in the right place at the right time?
4. Conversion: linking the customer journey to conversion rates.
The conversion pillar is most directly linked to sales performance. It allows you to link behaviors observed in-store to transaction data.
Metrics to compare across locations include the overall conversion rate (the ratio of visitors to buyers), conversion by zone to identify areas that drive or hinder purchases, checkout abandonment to detect barriers at the critical moment of checkout, exits without a purchase to improve sales team effectiveness, and retail media performance to quantify the impact of in-store signage and DOOH campaigns on traffic and conversion.
What is POS comparison?
POS benchmarking is a cross-store evaluation feature that enables network management by identifying best practices based on performance metrics and then replicating them across all locations. This is the fundamental principle of retail network benchmarking: a successful test store becomes the benchmark for hundreds of other retail locations.
How does a video analytics platform enable this real-time comparison?
The surveillance cameras already deployed in stores are a goldmine of untapped data. A platform like CORE connects these existing video feeds and transforms them into actionable data in real time, without requiring the installation of new sensors.
Video analytics algorithms process camera feeds in real time to generate structured metrics (foot traffic, customer journeys, interactions, conversion) that power comparative dashboards accessible to both operations management and on-the-ground teams.
The key to effective multi-site comparison is the ability to instantly identify performance gaps between sites, without requiring data expertise. In practice, this is achieved through unified dashboards that aggregate data from all sites on a single collaborative interface, the ability to compare sites and concepts to identify areas for improvement, instant access to data without waiting for reports, and real-time alerts when an anomaly is detected (critical queues, abandoned areas, abnormal conversion rates).
Simon Chopin, Chief Data Officer at Nhood, summarizes the added value: “CORE provides us with key insights in real time from our cameras: visitor journeys, hot and cold zones, brand popularity, wait times, and crowd movements.”
A crucial point for retail operations managers: data compliance. GDPR-compliant video analytics platforms operate without facial recognition, with anonymization occurring at the point of capture. All uploaded images are anonymized, ensuring ethical AI that respects civil liberties.
How long does it take to deploy a multi-site comparison solution?
Deployment speed is a key factor for retail executives who cannot afford lengthy and complex projects. By following a structured onboarding process: Day 0 corresponds to the kick-off meeting and the confirmation of requirements and KPIs; Day 15 marks the end of implementation and the start of data collection; Day 16 is dedicated to creating platform access and building visualizations; Day 30 is the first data review workshop, and Day 45 is the second workshop for review and adjustments. That’s less than 6 weeks from decision to the first operational cross-store comparison.
What are the measurable benefits for retail operations managers?
In terms of foot traffic, unique visitor counting allows staffing levels to be aligned with actual foot traffic to maximize sales, and visitor segmentation directly boosts the conversion rate through better customer insight. In the customer journey pillar, mapping the customer journey improves conversion and flow, while identifying friction points reduces cart abandonment. In the “interactions” pillar, analyzing sales associate interactions increases revenue by optimizing service. In the “conversion” pillar, tracking conversion rates by zone improves performance and profitability per square meter, and detecting cart abandonment at the checkout reduces lost sales.
Conclusion.
By 2026, comparing stores in real time will no longer be a competitive advantage reserved for large retailers—it will be a prerequisite for survival in a retail market that demands greater agility, precision, and operational efficiency.
Retail operations managers who adopt a data-driven approach to multi-site comparison—by linking foot traffic, customer journeys, interactions, and conversion on a unified interface—empower themselves to replicate best practices across the entire network, identify underperforming locations before sales figures indicate a problem, and make decisions based on facts, not estimates.