
Knowing how many people enter a store is useful. Knowing where they go, where they stop, where they abandon their shopping, and how they interact with the shelves is an entirely different matter. And that’s exactly what in-storecustomer journey video analyticsmakes possible. This guide explains the measurement mechanisms, the metrics generated, and how to translate them into concrete operational decisions.
What is in-store customer journey analysis?
The customer journey refers to all the movements and behaviors of a visitor from the moment they enter the store until they leave: the areas they pass through, the time spent in each space, the products they approach, and their interactions with staff.
Video analytics tools transform the feed from existing CCTV cameras into structured data on these behaviors without identifying individuals or storing personally identifiable images, in full compliance with the GDPR.
The 4 dimensions measured by video analytics
1. Traffic flows and densities
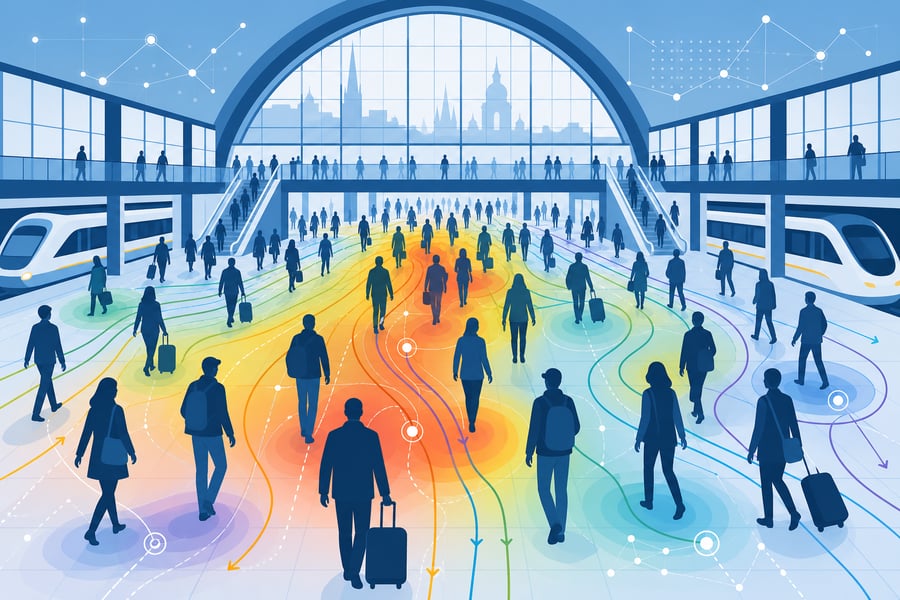
Video analytics calculates in real time the number of people present in each defined area of the store. This data generates foot trafficheatmaps that reveal high-traffic zones, dead zones, and transit corridors.
What this changes: identifying high-potential locations for premium merchandising, and those requiring corrective action (restocking, signage, lighting).
2. Time Spent in Each Zone
The time spent in front of a shelf or in a specific area is a much more accurate indicator of interest than simply passing through. An area that shoppers quickly walk through indicates a lack of appeal. An area where visitors linger but do not make a purchase indicates a conversion issue.
The combination of dwell time and conversion rate by zone is one of the most powerful indicators ofstore effectiveness.
3. Points of friction and abandonment
Video analysis detects atypical behaviors: sudden clusters of people, frequent U-turns, and recurring areas of hesitation. These signals help identify friction points along the customer journey: insufficient signage, missing restocking, or difficult access.
Real-world example: If 30% of visitors who enter an aisle leave without reaching the end, there is an issue with clarity or appeal that needs to be addressed.
4. Interactions with Staff
Video analysis also measures interactions between customers and sales associates: frequency of interactions, areas where they occur, and duration. This data helps optimize staff placement based on actual foot traffic patterns.
From Customer Tracking to Operational Decisions
Optimizing the store layout
Customer journey data reveals visitors’ natural flow patterns. A store whose layout aligns with customers’ spontaneous paths converts better because it reduces friction and displays the right products at the right moments along the customer journey.
Data-Driven Merchandising
Rather than placing high-margin products based on intuition or generic rules,retail analytics allows you to measure the actual impact of each merchandising change on visitor behavior.
Allocating Staff to the Right Locations
Tracking customertraffic by zone, combined with conversion data, reveals where staff have the greatest impact. A sales associate stationed in a high-traffic, low-conversion zone is more likely to influence results than one in an area that’s already performing well.
How CORE Measures the Customer Journey
CORE is an AI-powered video analytics platform that can be deployed on existing camera infrastructure. It generates the following in real time:
- Foottraffic heatmaps by zone and time slot
- Directional flowpatterns (where visitors come from, where they go next)
- Average visit durations by zone
- Zone conversion rates (zone entries / associated purchases)
- Behavioral alerts (lingering, clustering, abandonment)
All this data is generated from anonymous silhouettes. No faces are analyzed, and no biometric data is collected. GDPR compliance is built into the system’s architecture.
Frequently Asked Questions
Does video analysis of the customer journey require new cameras? No. CORE connects to the CCTV cameras already installed in the store. In the vast majority of cases, implementation does not require new equipment.
Do customers need to be informed about the use of video analytics? Yes. In-store notification (a sign at the entrance) is required by the GDPR, even for non-biometric analyses. XXII assists its clients in ensuring compliance with documentation requirements.
What is the difference between a foot traffic heat map and a foot traffic count? The count measures linear flow (entrances/exits). A heatmap measures the density of foot traffic in each area of the store over a given period. The two are complementary: foot traffic counting measures volume, while the heatmap reveals spatial distribution.
Can customer journey data be cross-referenced with point-of-sale data? Yes. CORE exposes its data via a REST API, which allows it to be cross-referenced with transaction data to calculate actual conversion rates by zone, time slot, and visitor type.
Conclusion
Video-based customer journey analysis transforms the retail store into a data-driven environment. It gives retail managers the tools to understand their visitors’ actual behavior (not their presumed intentions) and to derive concrete actions regarding merchandising, staffing, and store layout.
→ Request a CORE demo at your own location.