How can we exclude staff from the store visitor count?
Comparing wait times and congestion points across multiple stations first requires that the data be collected in the same way everywhere: same definitions, same reference zones, same time intervals. Without this consistency, a discrepancy between two stations primarily reflects how they were monitored, not how they are operated.
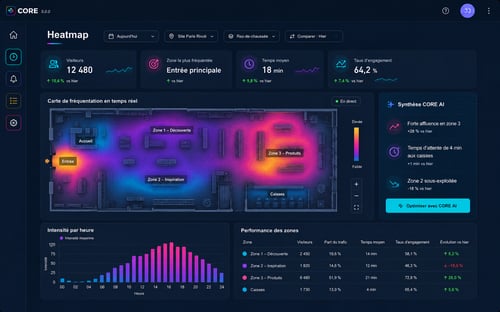
Once this condition is met, the comparison becomes a network management tool: it allows us to identify the locations that most negatively impact the passenger experience at comparable passenger volumes, pinpoint recurring critical time slots, and prioritize corrective actions. XXII applies this principle with its CORE platform, which uses existing cameras to generate traffic flow metrics without facial recognition.
Why Comparisons Between Stations Most Often Fail
The failure rarely stems from the technology. It stems from differing definitions. At one station, wait time is measured from the moment a passenger joins the line until they pass through security. At another, it starts at the entrance to the concourse. A third station measures average density across a large area and calls it congestion.
Time intervals also differ: a smoothed hourly average of five-minute peaks—which are precisely what operations seek to address. Finally, the reference areas do not cover the same surface areas, making the densities incomparable.
The first step in a comparison project is therefore documentary, not technical: write down the definitions, have them validated, and then apply them uniformly.
Which indicators allow for a comparison between sites
Four categories of indicators can be compared effectively, provided they are strictly defined.
Throughput
Number of people crossing a line per unit of time. This is the most robust indicator, as it is largely independent of the site’s geometry. It serves as the basis for measuring load.
Density per zone
The number of people present relative to the usable area of the zone. This indicator is meaningful only if the area is measured and documented for each zone; otherwise, comparisons between stations become arbitrary.
Travel time and waiting time
The duration between two passage points. A comparison requires that these two points be defined in an equivalent manner from one station to another, which is rarely straightforward in buildings with different layouts.
Threshold Exceedance Duration
The cumulative time during which a zone exceeds a density level deemed critical. This indicator is often the most useful for network management, as it directly reflects a perceived deterioration and lends itself well to ranking.
How to normalize stations of different sizes
A large station handles more passengers and, by definition, experiences more episodes of congestion. A raw ranking therefore penalizes size rather than operational performance. Three normalization methods correct this bias.
The first relates the indicator to passenger volume: for example, the duration that the threshold is exceeded per thousand passengers handled. The second compares each station to its own performance over a previous period, which measures change rather than a static level. The third groups stations by type—based on the number of platforms, the presence of transfers, or the share of regional traffic—and then compares stations within each group.
These three approaches are combined. Taken in isolation, each yields questionable conclusions.
What operational decisions result from the comparison
A comparison of stations informs different types of decisions depending on the time horizon.
- In the short term, it guides the allocation of staff to time slots where service degradation is most pronounced and predictable.
- In the medium term, it justifies organizational adjustments: opening an additional checkpoint, changing the direction of traffic flow, or relocating equipment that causes a bottleneck.
- In the longer term, it supports investment proposals by objectively identifying recurring bottlenecks.
The transition from measurement to decision-making involves an often-overlooked factor: knowing who is monitoring the indicator, how often, and what actions that person is authorized to initiate. A dashboard without a designated recipient has no effect.
How to Avoid Misleading Rankings
A few simple precautions can prevent hasty conclusions:
- Verify the availability of data streams before making any comparisons. A train station whose cameras were down for several days will show good numbers for the wrong reasons.
- Exclude atypical periods—such as construction, incidents, or exceptional events—or treat them separately.
- Always publish the measurement interval and the volume processed alongside the metric.
- Never use these comparisons as a criterion for evaluating individual teams, as this would lead them to focus on the metrics rather than on service quality.
What framework applies to the measurement of passenger flows?
Measuring passenger flow via video analysis in a publicly accessible space falls under the GDPR. The guiding principles are purpose limitation—restricted to flow management and security—data minimization—which involves generating counts and travel times rather than storing images—and informing those present.
The distinction from biometric processing is essential: counting silhouettes and measuring travel times does not at any point involve identifying an individual. The CNIL publishes resources on foot traffic measurement systems in public spaces, which serve as the reference to review prior to launching a project. When employees may be filmed, the rules regarding the monitoring of professional activities apply in addition.
Where to Start on a Network
A phased rollout yields better results than a blanket rollout. Start with three to five stations representative of different types, finalize the definitions within this scope, validate the consistency of the measurements through manual control counts, and then expand. This process takes a few weeks and avoids having to rebuild the entire reference framework once the entire network is equipped.
For this type of project, XXII’s CORE platform generates metrics from existing cameras and makes them available to operations management. The value lies less in detection than in the rigorous definition process that makes stations comparable.