How can you manage crowd flow in a stadium without facial recognition?
Every day, stores generate millions of data points on customer behavior. This includes customer journeys, the amount of time spent in front of a shelf, and areas that are either ignored or overcrowded. However, this information remains largely untapped due to a lack of tools capable of interpreting and analyzing it in real time. Video heat maps are changing that equation. By transforming video feeds from existing cameras into visual representations of customer movement, they enable retail operations managers and digital transformation leaders to optimize store layouts with unprecedented precision. This guide covers everything a decision-maker needs to know to deploy, operate, and monetize this technology in 2026.
We start with a simple observation: the physical world has a lot to say, but it speaks a language that few tools can translate. Video heat maps serve as the interface between raw camera footage and operational decision-making. Since 2015, XXII has been developing video analytics solutions designed to make physical spaces as measurable as a website, using a non-biometric approach that complies with the GDPR.
Key Points: Video Heat Maps in Retail in 2026
- Video heat maps convert footage from existing cameras into actionable visualizations of customer journeys and areas of interest.
- This technology identifies high-traffic “hot spots” and underutilized “cold spots” to guide layout decisions.
- XXII’s CORE platform analyzes video streams in real time while complying with GDPR requirements through native anonymization.
- Operations managers can measure the impact of merchandising initiatives and adjust resources based on peak foot traffic.
- Using heat maps helps reduce out-of-stock situations and measurably improve in-store conversion rates.
What is a video heatmap in retail?
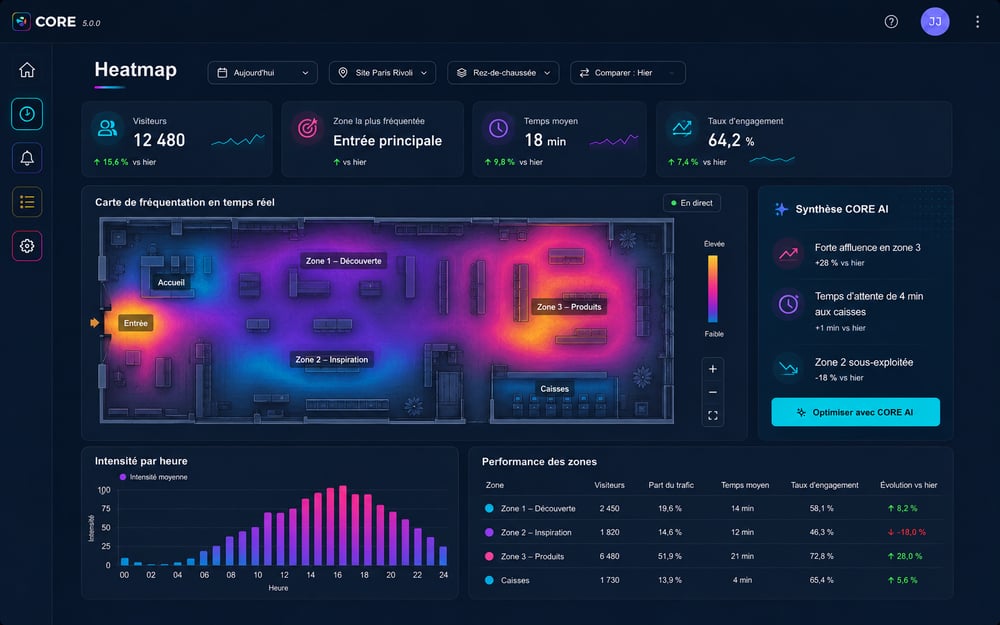
A video heatmap is a graphical representation overlaid on a store floor plan. It uses a color code to indicate foot traffic intensity in each area: warm colors (red, orange) indicate high-traffic areas, while cool colors (blue, green) reveal areas with low foot traffic.
This visualization is generated by analyzing video feeds captured by existing security cameras. Computer vision algorithms detect silhouettes, track their movements, and aggregate this data in real time or over defined periods.
This provides a dynamic snapshot of how visitors actually use the space. This information, which was previously inaccessible or costly to collect through one-off field studies, is now available on an ongoing basis and at a large scale.
How does video analytics work to generate heat maps?
The process involves several technical steps. First, existing IP cameras transmit their video streams to an analytics platform. No additional hardware is required if the camera infrastructure is already in place.
Silhouette Detection and Tracking
Detection algorithms identify every person within the camera’s field of view. They distinguish visitors from stationary objects or staff members using non-biometric exclusion methods. Tracking is performed frame by frame to reconstruct movement paths.
This step relies on convolutional neural networks trained to recognize human forms under various conditions: changing lighting, high foot traffic, and multiple camera angles. The quality of the detection determines the reliability of the generated heat maps.
Aggregation and Visualization
Individual trajectories are then aggregated to produce a density map. Each pixel on the store floor plan is assigned a value proportional to the number of passes or the cumulative time spent there.
The final visualization uses an intuitive color gradient. Operations teams can filter the data by time slot, day of the week, or promotional period. This level of detail makes it possible to identify behavioral patterns invisible to the naked eye.
Why Video Heat Maps Are Essential for Store Layout
Store layout has traditionally relied on on-the-ground experience, sales history, and a few ad-hoc studies. These approaches have limitations when it comes to managing networks of dozens or hundreds of stores where every square meter must justify its performance.
Identifying Cold and Hot Zones
Heat maps immediately reveal inconsistencies between merchandising intent and actual customer flow. A strategic product category may end up in a low-traffic area. Relevant cross-merchandising may be positioned away from natural customer pathways.
This visibility allows you to reallocate space based on observed customer behavior. Moving a category from a cold zone to a hot zone automatically generates more exposure and increases the chances of conversion.
Measuring the Impact of Merchandising Initiatives
During a sales promotion, heat maps help verify whether displays are actually capturing foot traffic. Are shoppers walking through the event stage or around it? Are shelf stoppers positioned in high-traffic aisles or in overlooked corners?
By comparing heat maps before, during, and after a promotion, teams can objectively determine what works. They capitalize on high-performing displays and discontinue those that fail to attract attention.
How to Reduce Cold Spots Using Heat Maps
A cold zone isn’t inevitable. It often results from an issue with foot traffic flow, signage, or product placement. Heat maps provide the data needed to diagnose the cause and test solutions.
Analyze Trajectories to Understand Avoidance Patterns
Visitors do not follow a linear path. They take shortcuts, avoid certain aisles, and linger in front of specific products. By overlaying the most common paths onto the store layout, you can identify areas that are consistently bypassed.
This analysis sometimes reveals physical obstacles: a poorly placed promotional display, bulky furniture, or insufficient lighting. Correcting these issues may be enough to revitalize an underutilized area.
Test and Iterate with an A/B Approach
Heat maps enable rigorous layout testing. Two category layouts are compared across control stores; the impact on area foot traffic and conversion rates is measured; and only the winning layouts are rolled out across the entire network.
This “test and learn” approach replaces intuitive decisions with choices based on verifiable data. XXII supports retailers in this process with multi-site comparison tools integrated into the CORE platform.
What Operational Data Can Be Derived from Heat Maps
Heat maps are more than just visualizations. They provide operational metrics that store managers and network executives can use on a daily basis.
Time Spent by Zone
Beyond simply counting foot traffic, we measure the average time visitors spend in each zone. A high dwell time may indicate interest in the products on display or, conversely, difficulty finding what they’re looking for.
Cross-referencing this dwell time with sales data helps distinguish engagement zones (long dwell time, strong sales) from friction zones (long dwell time, weak sales).
Penetration and Bounce Rates
The penetration rate measures the percentage of visitors who actually enter a given zone relative to the total number of store entries. The bounce rate indicates how many visitors leave a zone quickly without lingering.
These metrics help evaluate the attractiveness of a retail environment and identify issues with the customer journey. An area with a low penetration rate but a low bounce rate attracts few visitors but retains those who do come. An area with a high penetration rate and a high bounce rate attracts visitors but disappoints them.
How XXII Enables Large-Scale Use of Heat Maps
We developed the CORE platform in response to an observation: high-traffic locations constantly generate valuable information about their own operations, but this information remains largely untapped. The platform analyzes video streams from existing camera infrastructure in real time and transforms them into directly actionable operational data.
Multi-site aggregation and unified dashboards
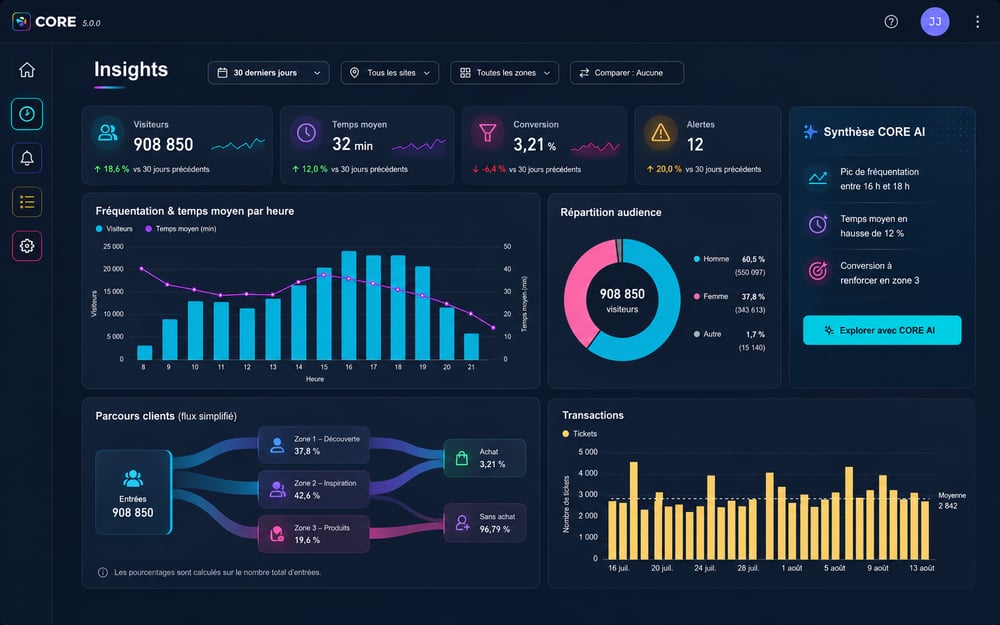
XXII enables the aggregation of heat maps from all retail locations within a network. This centralized approach facilitates comparisons between stores of the same type, the identification of performance gaps, and the sharing of best practices.
The dashboards display foot traffic KPIs alongside business metrics: revenue, conversion rate, and margin. This integrated view transforms heat maps into a strategic management tool.
Deployment on Existing Infrastructure
This approach allows us to deploy quickly, without requiring retailers to invest in new sensors or overhaul their existing infrastructure. This strategic choice significantly shortens the time between deployment and the first measurable results.
The XXII solution integrates with existing video management systems (VMS). IT teams do not have to manage new equipment, which reduces operational complexity and maintenance costs.
GDPR Compliance: How to Analyze Video Without Storing Personal Data
XXII’s governance places particular emphasis on the ethical issues related to video analysis. For us, this distinction is not merely a regulatory detail; it is a founding principle that shapes all of our product decisions.
Native anonymization of silhouettes
The CORE platform processes video streams without identifying individuals. The algorithms detect silhouettes, not faces. No biometric data is collected or stored. This non-biometric approach meets GDPR requirements by design.
XXII develops tools for operational performance, not tools that identify individuals. This ethical rigor goes hand in hand with a resolutely pragmatic product approach.
Controlled Retention and Local Processing
Stream metadata (counts, time spent on-site, aggregated trajectories) is retained for periods defined in consultation with the client. Raw images are not stored once processing is complete.
For retailers requiring maximum control, processing can take place at the camera edge (edge computing) or on on-premises servers. This deployment flexibility allows the architecture to be adapted to the strictest security policies.
What are the retail use cases for video heat maps?
Since our launch, we’ve focused on sectors where real-time analysis of foot traffic has a direct and measurable operational impact. Retail is one of the most promising application areas.
Optimizing supermarket merchandising
Grocery retailers use heat maps to position high-margin products along natural customer paths. They identify underutilized sections and test layout changes before rolling them out across the store.
Analyzing dwell times by aisle helps optimize shelf space: an aisle where customers linger deserves more shelf space, while one that customers pass through quickly can be made more compact.
Managing Peak Foot Traffic in Specialty Stores
Retailers in the ready-to-wear, home improvement, and electronics sectors face significant fluctuations in foot traffic depending on the time of day and day of the week. Heat maps help anticipate these peaks and adjust staffing levels accordingly.
Store managers can view in real time which areas are becoming overcrowded. They can reassign staff to crowded aisles or open additional checkout lanes before lines form.
Analysis of the Customer Journey in Shopping Malls
Mall managers use heat maps to understand how visitors move between stores. This information guides decisions on store placement and rent negotiations.
High-traffic areas justify higher rental rates. Low-traffic areas can be revitalized through events or anchor stores capable of attracting foot traffic.
How to Measure the ROI of Video Heat Maps
Investment in a video analytics solution must be justified by measurable operational results. Several metrics can be used to evaluate return on investment.
Improved conversion rate
The conversion rate (the ratio of visitors to buyers) is the most direct indicator. Retailers that use heat maps to optimize their store layout generally see an improvement in this rate.
This improvement is due to better product visibility, reduced friction in the customer journey, and more effective placement of promotional offers.
Reduction in Stockouts
By identifying high-engagement areas, teams can better anticipate restocking needs. They focus their efforts on the shelves that generate the most product interactions.
This targeted approach reduces instances where a customer encounters an empty shelf, which has a direct impact on sales and customer satisfaction.
Optimization of Labor Costs
Aligning schedules with actual foot traffic patterns reduces staffing hours during slow periods and bolsters teams during peak times. This dynamic allocation generates savings without compromising service quality.
How to Deploy a Video Heat Map Solution Step by Step
Deploying a video analytics solution follows a structured process. Each step sets the stage for the success of the subsequent ones.
Audit of the Existing Camera Infrastructure
The first step is to take inventory of the existing cameras: models, resolutions, coverage areas, and the condition of the network cabling. This mapping helps identify any necessary additions.
Modern IP cameras generally offer sufficient quality for video analytics. Older models may require an upgrade or targeted replacement.
Defining Areas of Interest and KPIs
Next, the areas to be analyzed within the store are delineated: aisles, entryways, checkout lanes, and promotional areas. Each area is assigned an identifier and associated performance objectives.
This step involves the merchandising, marketing, and operations teams. Their on-the-ground knowledge allows the metrics to be calibrated based on actual business challenges.
Integration and Calibration of the Solution
The video analytics solution is connected to the camera feeds via the existing video management system. A calibration phase adjusts the algorithms to the site’s specific characteristics: lighting, camera placement, and foot traffic density.
The XXII teams provide dedicated support throughout this phase. Each project is built around operational objectives that can be measured within the first few weeks.
Team Training and Go-Live
End users (store managers, merchandisers, network analysts) are trained to use the dashboards. They learn to interpret heat maps, filter data, and translate insights into actionable steps.
The go-live is accompanied by a ramp-up period during which the XXII teams remain on hand to adjust configurations and answer operational questions.
What Trends Can We Expect for Video Heat Maps in 2026 and Beyond?
Retail video analytics is evolving rapidly driven by advances in computer vision and data processing. Several trends are emerging for the coming years.
Integration of Visual Language Models (VLM)
Vision-Language Models (VLMs) enable users to query video streams using natural language. A manager could ask, “Show me the moments when more than ten people were in front of the clearance aisle,” and receive a response without needing to understand technical queries.
This democratization of access to video data broadens the user base and accelerates decision-making.
Predictive Analysis of Video Feeds
Machine learning algorithms analyze historical foot traffic data to anticipate future patterns. Managers receive alerts before an area becomes overcrowded—not after.
This predictive capability transforms the operational approach: we’re shifting from reactive to proactive traffic management.
Convergence with transactional data
Cross-referencing heat maps with checkout data enriches the analysis. We correlate the physical customer journey with the shopping cart to identify the areas that convert best and those that generate traffic without sales.
XXII facilitates this convergence through connectors with point-of-sale systems and off-the-shelf BI tools.
In conclusion: how to choose the right video heat map solution
The choice of a video analytics solution for retail depends on several criteria. Compatibility with existing camera infrastructure avoids costly hardware investments. Native GDPR compliance protects the retailer and its customers. The ability to aggregate data across multiple locations enables consistent network management.
For the years ahead, XXII’s ambition remains guided by our founding conviction: the best technology is not the one that imposes the most complexity, but the one that makes what truly matters visible—simply and quickly. Our goal is to become the European leader in real-time analytics for high-traffic locations, maintaining at every step our commitment to concrete, measurable results that respect individuals.
XXII is rooted in the belief that the physical world has a lot to say, and that the right technology must simply know how to listen to it—at the right time, for the right reasons.
FAQ: Video Heat Maps in Retail in 2026
What is a “cold zone” in retail, and how can it be detected?
A “cold zone” is an area of the store that receives few visitors relative to its size or commercial potential. Video heat maps automatically detect these zones using color coding: shades of blue or green indicate low foot traffic. XXII identifies these zones in real time, enabling teams to respond quickly.
How long does it take to deploy a video heat map solution?
Deployment time varies depending on the size of the network and the condition of the existing infrastructure. At a pilot site with compatible IP cameras, going live can take a few weeks. XXII supports each deployment with dedicated assistance and measurable goals starting in the first few weeks.
Are video heat maps GDPR-compliant?
Yes, provided you use a solution designed with a non-biometric approach. XXII’s CORE platform detects silhouettes without identifying individuals. No personal data is collected or stored, which meets GDPR requirements by design.
Can existing security cameras be used to generate heat maps?
Yes, that’s actually the recommended approach. XXII transforms existing cameras into smart sensors without requiring additional hardware. This approach reduces deployment costs and accelerates return on investment.
How do heat maps help improve in-store conversion rates?
By revealing visitors’ actual paths, heat maps enable retailers to place flagship products in high-traffic areas. XXII helps retailers optimize their store layouts based on verifiable data, which results in increased product exposure and higher conversion rates.
What is the difference between a heat map and people counting?
People counting measures the number of entries and exits. Heat maps go a step further by visualizing where visitors move and how long they stay in each area. XXII combines both types of data to provide a comprehensive view of foot traffic.